SA Deforestation Monitoring

The Challenge
Monitoring large-scale environmental changes like deforestation and water depletion is challenging due to the vast areas involved and the need for frequent, high-resolution data. Reliable measurement of forest cover change and water body extent is critical for nature-based carbon projects and environmental stewardship. Traditional ground surveys are insufficient for real-time policy and conservation decisions.
Datasets
The project utilizes the following datasets, all integrated via Google Earth Engine for efficient processing:
Optical & SAR
- Sentinel-2: Multispectral data for land cover analysis.
- Sentinel-1 SAR: Radar imagery for cloud-penetrating observations.
- Landsat 5/8/9: Long-term dynamics and thermal infrared data.
Environmental Indices
- Hansen GFC: Baseline forest loss and gain tracking.
- Dynamic World: Real-time land use classifications.
- ESA WorldCover: Annual global land cover maps.
Ancillary Data
- HydroSHEDS: Stream networks and watershed boundaries.
- OpenStreetMap: Critical infrastructure (dams, rivers).
- FAO GAUL: Standardized administrative boundaries.
The Workflow
The following diagram outlines the overall project workflow, from data ingestion to final visualization:
(cloud mask, SAR prep, clip)"] B["Annual Composites 2015–2024
(NDVI/NDWI, DW Trees mean)"] C["Change Detection
(NDVI/DW transitions, SAR cues)"] D["Post-process & Vectorize
(min-area filters, cleaning)"] E["Summaries & QA/QC sample points"] end subgraph Exports["Exports"] R1["COG/GeoTIFF rasters"] V1["GeoJSON/Shapefile vectors"] T1["CSV time series"] M1["EE Tile Service / titiler"] end subgraph Tools["Apps"] QG["QGIS\nvisualize/edit/validate"] AG["ArcGIS Online\nhost layers & dashboard"] end Data --> A A --> B --> C --> D --> E E --> R1 E --> V1 E --> T1 B --> M1 R1 --> QG R1 --> AG V1 --> AG T1 --> AG M1 --> AG
Methodology
- Tree Cover Monitoring: Computing NDVI thresholds and Random Forest classification to detect forest health and loss.
- Water Dynamics: Using MNDWI to track surface water changes near critical infrastructure.
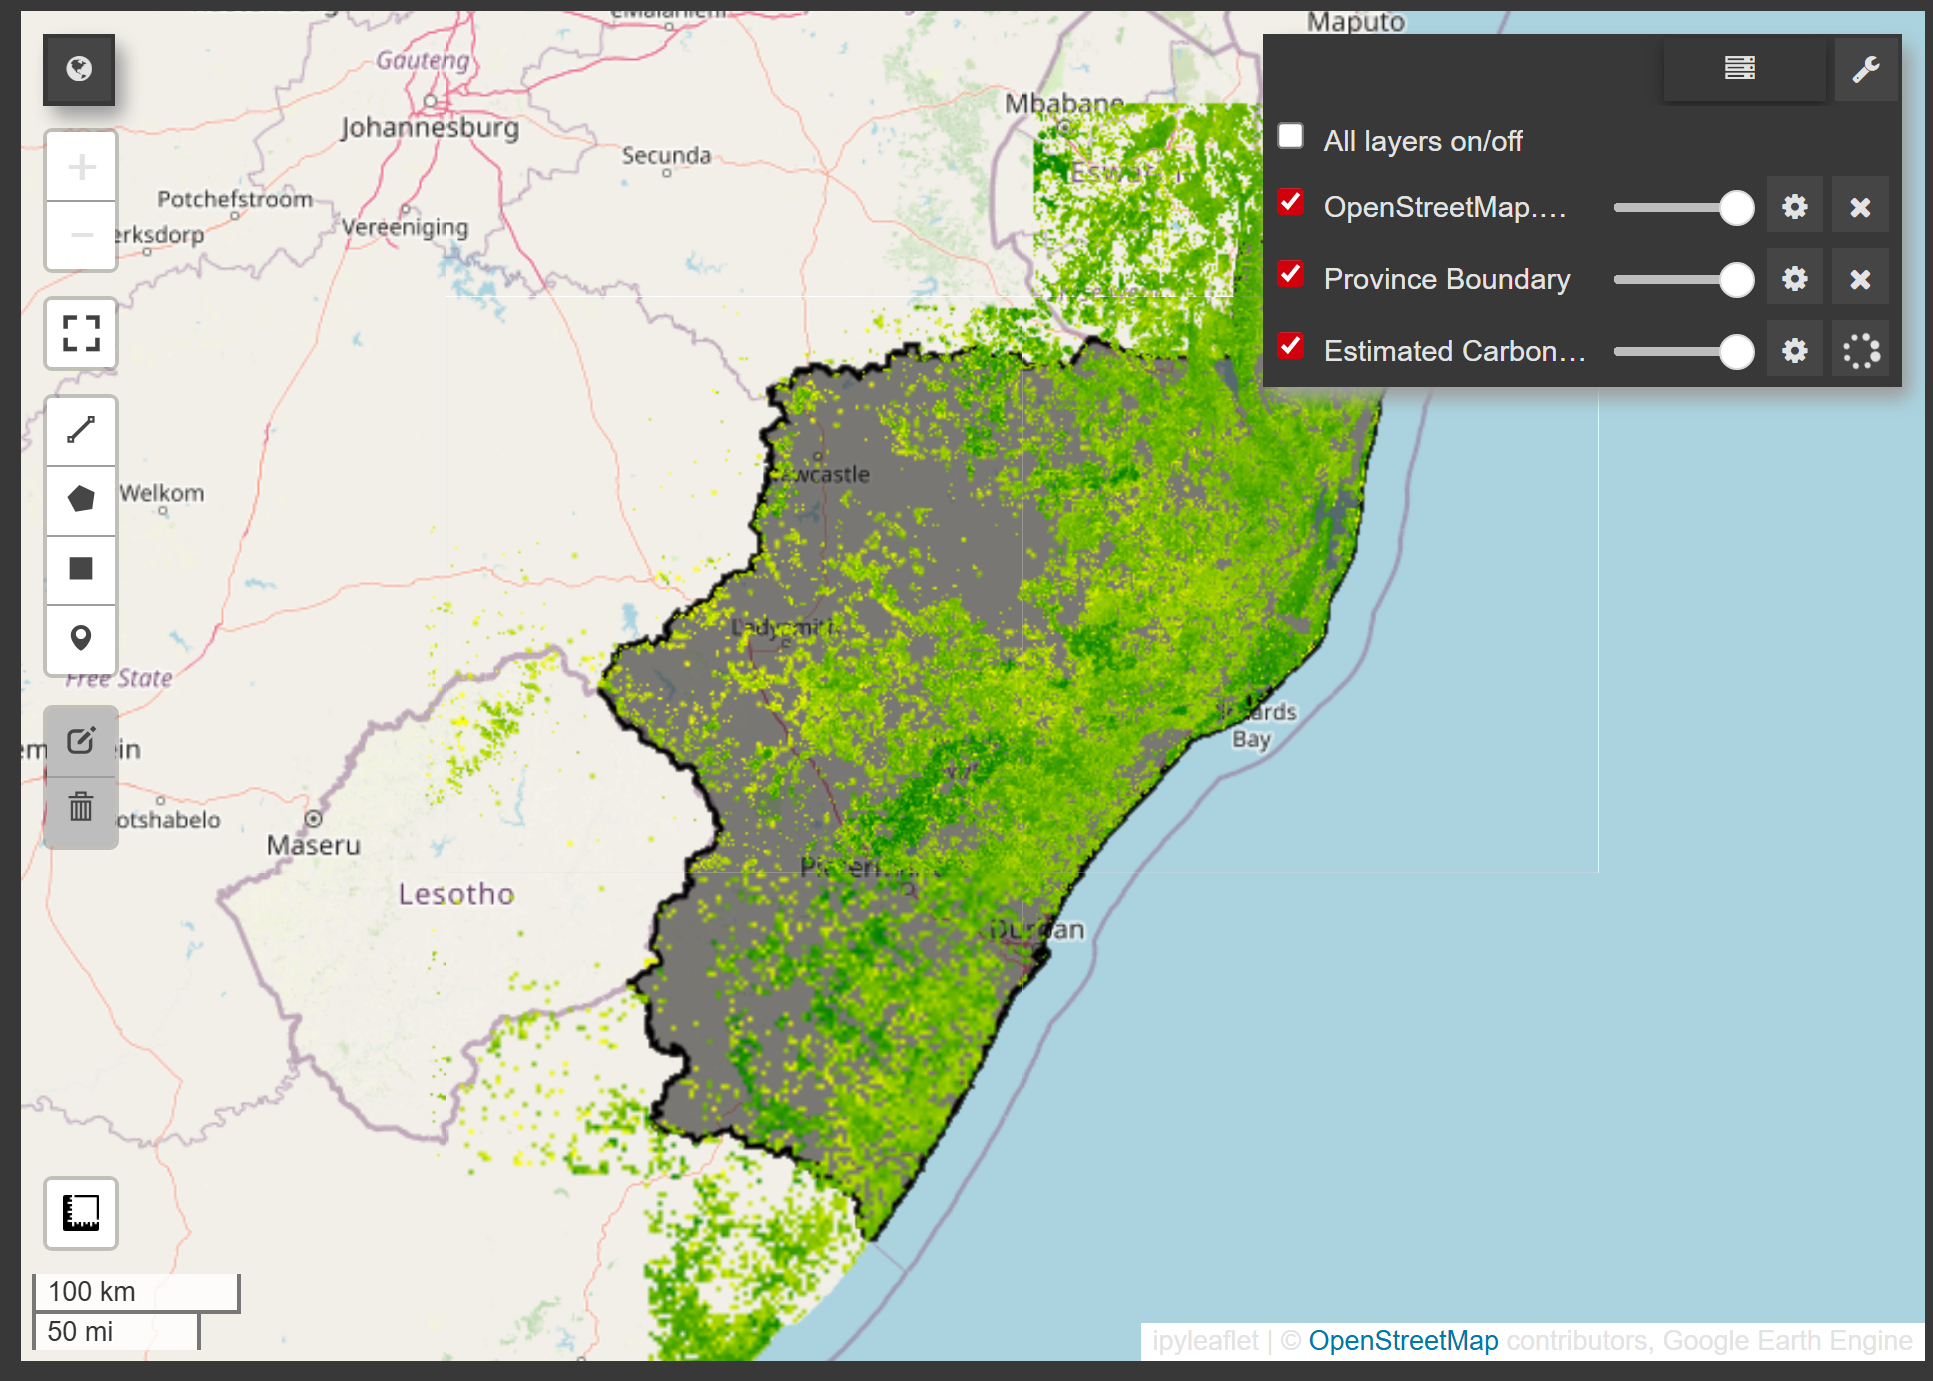
- Carbon Stock Analysis: Training a Random Forest classifier to predict Above-Ground Biomass Density (AGBD) using multispectral indices and DEM data.
- Emissions MRV: Correlating surface temperatures and atmospheric methane data with deforestation patterns.
Results & Visualization
The automated pipeline generates high-resolution maps and datasets for Monitoring, Reporting, and Verification (MRV).


Data-Driven Conservation
Need a similar monitoring pipeline for your region or project?
Collaborate on MonitoringTechnologies Used
- Cloud Platform: Google Earth Engine (JavaScript & Python APIs)
- Analysis: geemap, ee-python-client, scikit-learn (Random Forest)
- Visualization: ArcGIS Online, Folium, Matplotlib
- Data Export: Cloud Optimized GeoTIFF (COG), GeoJSON, CSV